Deep ocean temperature changes
Bildnummer 11727874
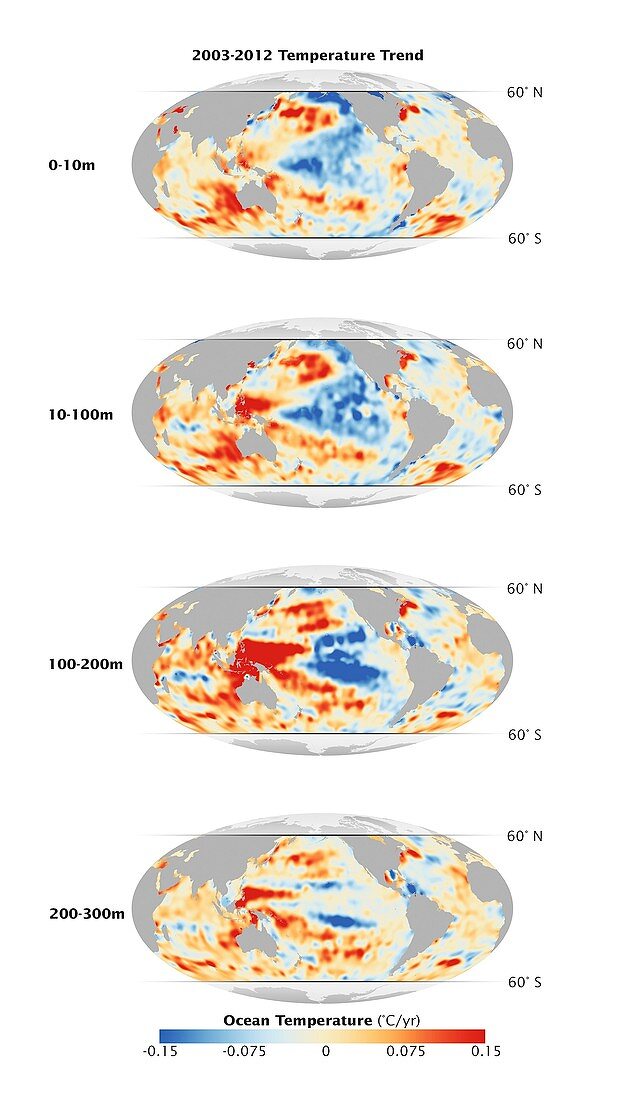
| Maps showing the changes in ocean temperatures between 2003 and 2012 at different depths. The colour scale runs from dark blue (minus 0.15 degrees Celsius decrease),through light blue and beige (no change) to orange and red (0.15 degree Celsius increase). Much of the heat increase expected from global warming is being stored in the oceans' depths,leading to a levelling off of surface temperatures. The greatest warming is seen in the western Pacific and eastern Indian Ocean at between 100-200 metres | |
| Lizenzart: | Lizenzpflichtig |
| Credit: | Science Photo Library / NASA |
| Bildgröße: | 2225 px × 3957 px |
| Modell-Rechte: | nicht erforderlich |
| Eigentums-Rechte: | nicht erforderlich |
| Restrictions: | - |
Preise für dieses Bild ab 15 €
Universitäten & Organisationen
(Informationsmaterial Digital, Informationsmaterial Print, Lehrmaterial Digital etc.)
ab 15 €
Redaktionell
(Bücher, Bücher: Sach- und Fachliteratur, Digitale Medien (redaktionell) etc.)
ab 30 €
Werbung
(Anzeigen, Aussenwerbung, Digitale Medien, Fernsehwerbung, Karten, Werbemittel, Zeitschriften etc.)
ab 55 €
Handelsprodukte
(bedruckte Textilie, Kalender, Postkarte, Grußkarte, Verpackung etc.)
ab 75 €
Pauschalpreise
Rechtepakete für die unbeschränkte Bildnutzung in Print oder Online
ab 495 €