Global surface currents 2005-2007
Bildnummer 11653000
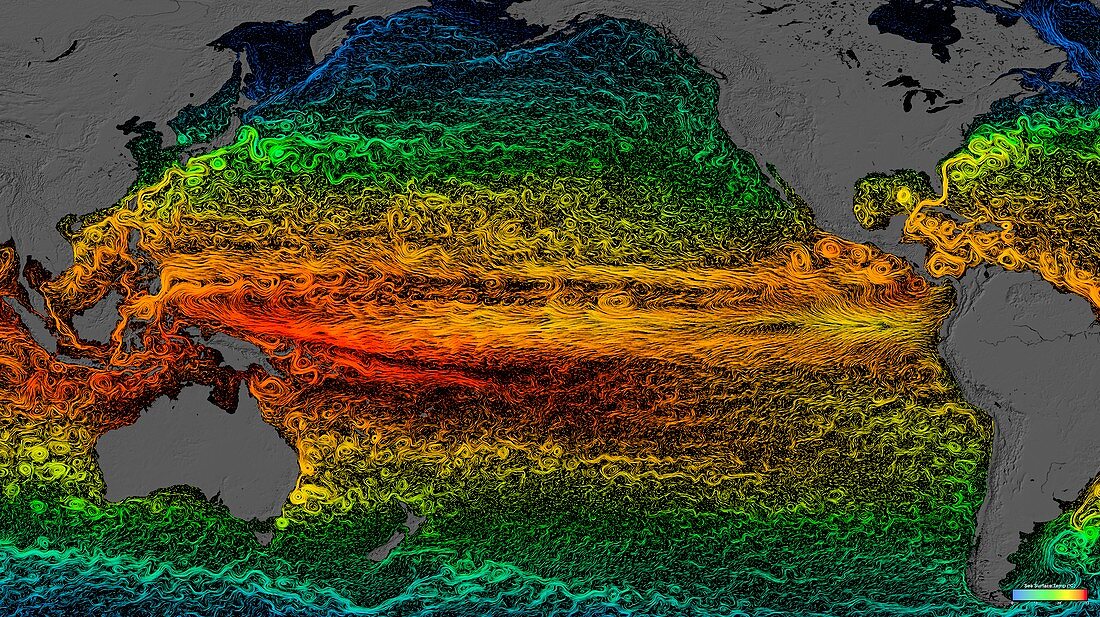
| Global surface currents 2005-2007. Computer visualisation showing ocean surface currents around the world,centred on the Pacific Ocean,during the period from June 2005 to December 2007. The temperature of the waters is colour-coded from blue (cold),through yellow,to red (hot). This visualisation was produced using model output from the joint MIT/JPL project: 'Estimating the Circulation and Climate of the Ocean,Phase II' (ECCO2). ECCO2 uses the MIT (Massachusetts Institute of Technology) general circulation model (MITgcm) to synthesise satellite and in-situ data of the global ocean and sea-ice at resolutions that begin to resolve ocean eddies and other narrow current systems,which transport heat and carbon in the oceans | |
| Lizenzart: | Lizenzpflichtig |
| Credit: | Science Photo Library / NASA |
| Bildgröße: | 5599 px × 3143 px |
| Modell-Rechte: | nicht erforderlich |
| Eigentums-Rechte: | nicht erforderlich |
| Restrictions: | - |
Preise für dieses Bild ab 15 €
Universitäten & Organisationen
(Informationsmaterial Digital, Informationsmaterial Print, Lehrmaterial Digital etc.)
ab 15 €
Redaktionell
(Bücher, Bücher: Sach- und Fachliteratur, Digitale Medien (redaktionell) etc.)
ab 30 €
Werbung
(Anzeigen, Aussenwerbung, Digitale Medien, Fernsehwerbung, Karten, Werbemittel, Zeitschriften etc.)
ab 55 €
Handelsprodukte
(bedruckte Textilie, Kalender, Postkarte, Grußkarte, Verpackung etc.)
ab 75 €
Pauschalpreise
Rechtepakete für die unbeschränkte Bildnutzung in Print oder Online
ab 495 €
Keywords
- 21. Jahrhundert,
- abgebildet,
- aktuell,
- aktuelles System,
- Amerikanisch,
- Antarktis,
- Asiatisch,
- Asien,
- Atlantisch,
- Australien,
- Bewegung,
- Bewegungen,
- cool,
- Erdbeobachtung,
- Erde,
- Erdkunde,
- farbcodiert,
- geografisch,
- Geographie,
- heiß,
- Hitze,
- Hydrologie,
- Illustration,
- Kalt,
- Karte,
- Kontinent,
- Kontinente,
- Kunstwerk,
- Küste,
- Küsten-,
- Meer,
- mit JPL,
- mitgcm,
- Nordamerika,
- Ozean,
- Ozeane,
- Pazifik,
- Phase 2,
- Südamerika,
- Südlicher Ozean,
- Südostasien,
- Temperatur,
- Transport,
- Umwelt,
- Umweltwissenschaften,
- Wasser,
- Welt,
- Weltall,
- weltweit,
- Zwei