Indian Ocean,chlorophyll and bathymetry
Bildnummer 11648935
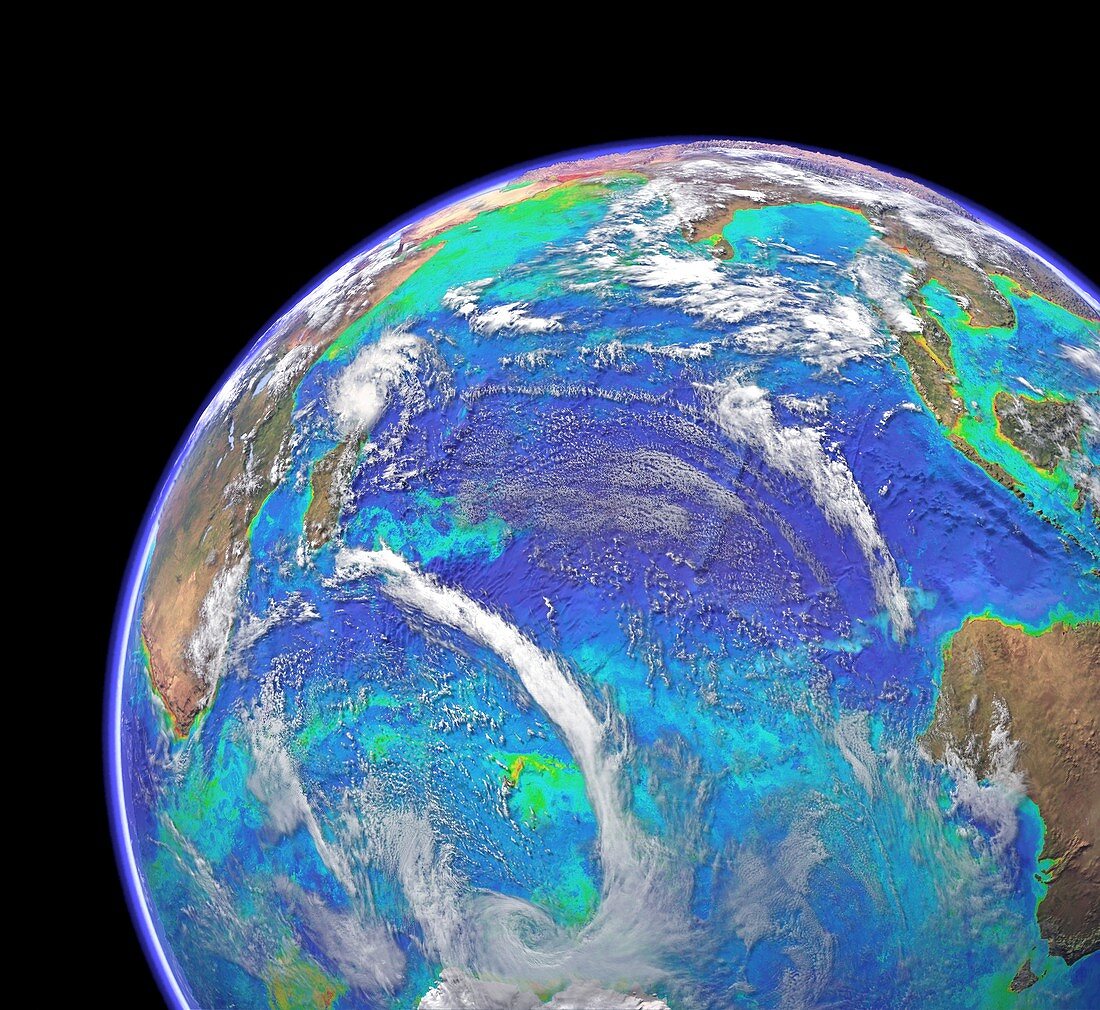
| Indian Ocean,chlorophyll concentration and bathymetry with clouds. Computer graphic of the Indian Ocean on an Earth globe,generated using satellite and mapping data. Bathymetry data is used to show the contours,ridges,peaks and plateaus of the seabed. Satellite-measured ocean chlorophyll concentrations are colour-coded: high values in red,yellow and green,low values in blue and purple. Chlorophyll is present in photosynthesising plankton blooming where nutrients are concentrated where currents meet,deep water upwells,or nutrients run off from the land. Chlorophyll and cloud data obtained by the MODIS sensor on NASA's Aqua satellite | |
| Lizenzart: | Lizenzpflichtig |
| Credit: | Science Photo Library / Planetary Visions |
| Bildgröße: | 4399 px × 4039 px |
| Modell-Rechte: | nicht erforderlich |
| Eigentums-Rechte: | nicht erforderlich |
| Restrictions: | - |
Preise für dieses Bild ab 15 €
Universitäten & Organisationen
(Informationsmaterial Digital, Informationsmaterial Print, Lehrmaterial Digital etc.)
ab 15 €
Redaktionell
(Bücher, Bücher: Sach- und Fachliteratur, Digitale Medien (redaktionell) etc.)
ab 30 €
Werbung
(Anzeigen, Aussenwerbung, Digitale Medien, Fernsehwerbung, Karten, Werbemittel, Zeitschriften etc.)
ab 55 €
Handelsprodukte
(bedruckte Textilie, Kalender, Postkarte, Grußkarte, Verpackung etc.)
ab 75 €
Pauschalpreise
Rechtepakete für die unbeschränkte Bildnutzung in Print oder Online
ab 495 €
Keywords
- Afrika,
- Afrikanisch,
- Antarktis,
- aqua,
- Asiatisch,
- Asien,
- Australien,
- australisch,
- Bathymetrie,
- bathymetrisch,
- Biologie,
- biologisch,
- Blüte,
- Botanik,
- botanisch,
- Chlorophyll,
- Erdbeobachtung,
- Erde,
- Erdkunde,
- ERS-1,
- Fauna,
- Flora,
- Geologie,
- geologisch,
- Globus,
- Grenze,
- Indien,
- Indischer Ozean,
- Indonesien,
- Insel,
- Inseln,
- Konzentration,
- Konzentrationen,
- Küsten,
- Küsten-,
- Land,
- Madagaskar,
- Malaiischer Archipel,
- Malaysia,
- Marine,
- Mauritius,
- Meer,
- Meeresbiologie,
- Meeresboden,
- Meereskunde,
- Meteorologie,
- meteorologisch,
- modis,
- Natur,
- neunzig Ostgrat,
- Ozean,
- Photosynthese,
- Planet,
- Plankton,
- Satellit,
- Satellitenbild,
- Seismologie,
- Sri Lanka,
- tektonischen Platten,
- Tiefe,
- topografisch,
- Topographie,
- Tropensturm,
- Weltall,
- Wetter,
- Wolken,
- Wolkenbank,
- Wolkendecke,
- Wolkig,
- Zoologie,
- zoologisch