Sea surface temperature simulation
Bildnummer 11613885
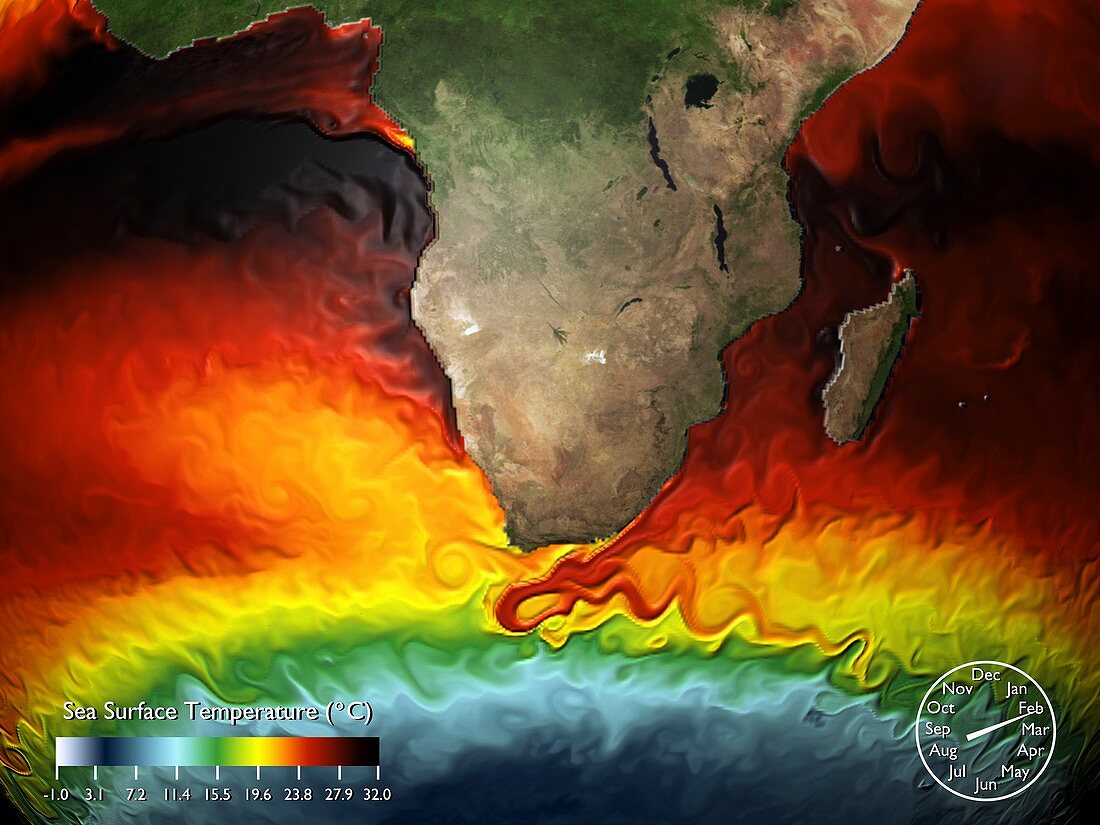
| Sea surface temperature simulation. Screenshot from a simulation of sea surface temperatures (SST) around southern Africa as modelled by the Geophysical Fluid Dynamics Laboratory (GFDL). This is a division of the National Oceanic and Atmospheric Administration (NOAA). The key shows that this point in the simulation is in February (lower right) and includes a colour-coded temperature scale (lower left) in degrees Celsius. The temperatures range from cold (white and blue) to cool (green) to warm (yellow and red) to hot (black). The simulation,published in 2008,shows eddies in various major ocean currents | |
| Lizenzart: | Lizenzpflichtig |
| Credit: | Science Photo Library / GFDL / NOAA |
| Bildgröße: | 4831 px × 3623 px |
| Modell-Rechte: | nicht erforderlich |
| Eigentums-Rechte: | nicht erforderlich |
| Restrictions: |
|
Preise für dieses Bild ab 15 €
Universitäten & Organisationen
(Informationsmaterial Digital, Informationsmaterial Print, Lehrmaterial Digital etc.)
ab 15 €
Redaktionell
(Bücher, Bücher: Sach- und Fachliteratur, Digitale Medien (redaktionell) etc.)
ab 30 €
Werbung
(Anzeigen, Aussenwerbung, Digitale Medien, Fernsehwerbung, Karten, Werbemittel, Zeitschriften etc.)
ab 55 €
Handelsprodukte
(bedruckte Textilie, Kalender, Postkarte, Grußkarte, Verpackung etc.)
ab 75 €
Pauschalpreise
Rechtepakete für die unbeschränkte Bildnutzung in Print oder Online
ab 495 €
Keywords
- 21. Jahrhundert,
- Afrika,
- Afrikanisch,
- aktuell,
- Atlantischer Ozean,
- Erdbeobachtung,
- Erde,
- Erdkunde,
- farbcodiert,
- Farben,
- Februar,
- Indischer Ozean,
- Klimatologie,
- klimatologisch,
- Madagaskar,
- Marine,
- Maßstab,
- Meer,
- Meereskunde,
- Meteorologie,
- meteorologisch,
- Modell-,
- Natur,
- NOAA,
- Ozean,
- ozeanisch,
- Simulation,
- Sommer,
- sst,
- Südafrika,
- südlichen Hemisphäre,
- Südlicher Ozean,
- Temperatur,
- Umwelt,
- Wetter