La Nina,December 2010
Bildnummer 11595619
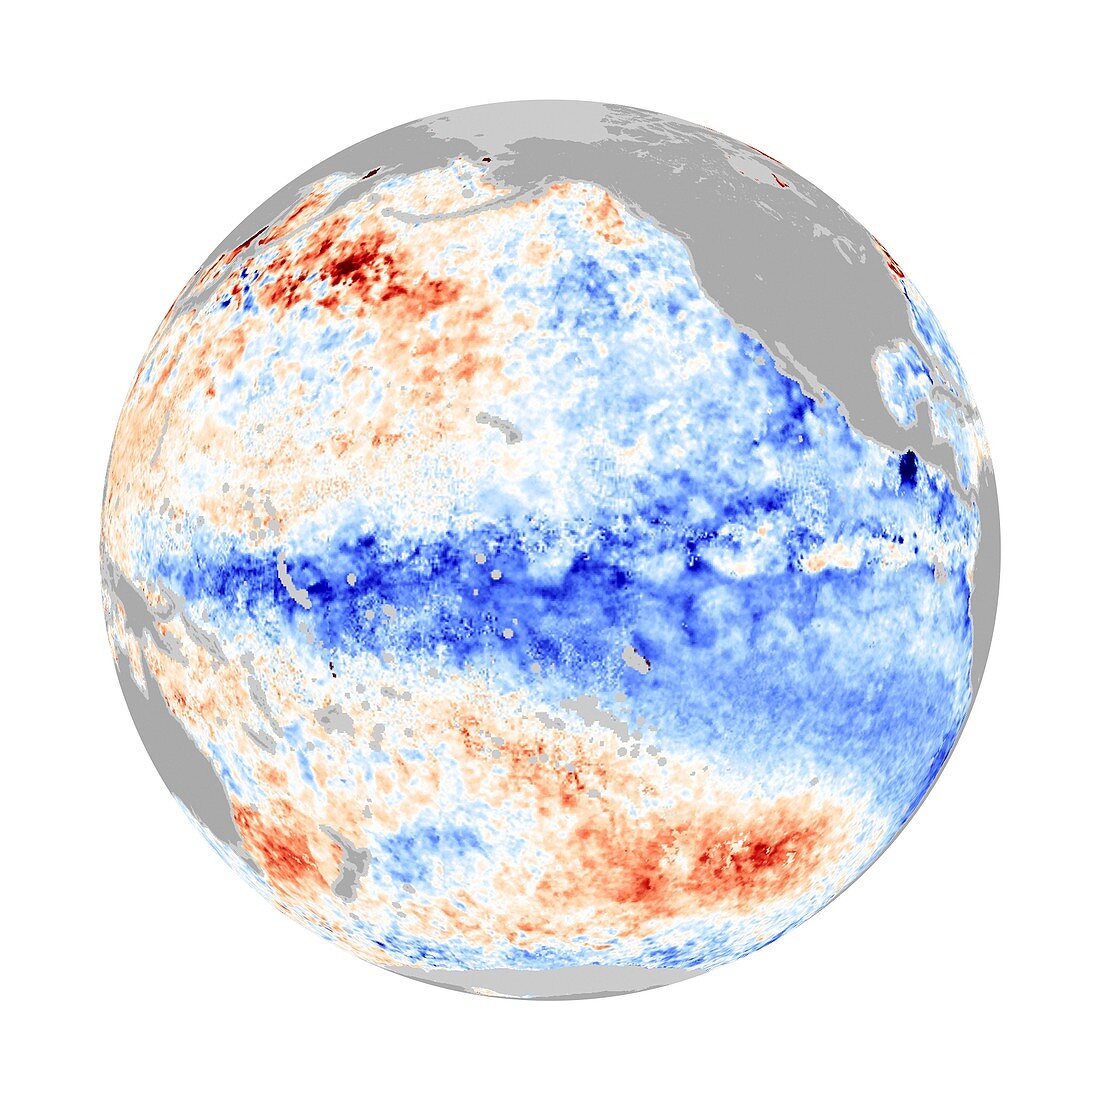
| La Nina,December 2010. Map showing Pacific Ocean surface temperatures in December 2010 compared to the average temperature for that period. Blue areas are cooler than average and red areas are warmer than average. The large blue area across centre is indicative of a La Nina event. La Nina effects weather systems across the world. In December it caused catastrophic floods in Australia,Sri Lanka and Brazil,and drought in Argentina. Image obtained by the Advanced Microwave Scanning Radiometer for EOS (AMSR-E) on NASA's aqua satellite | |
| Lizenzart: | Lizenzpflichtig |
| Credit: | Science Photo Library / NASA |
| Bildgröße: | 4193 px × 4193 px |
| Modell-Rechte: | nicht erforderlich |
| Eigentums-Rechte: | nicht erforderlich |
| Restrictions: | - |
Preise für dieses Bild ab 15 €
Universitäten & Organisationen
(Informationsmaterial Digital, Informationsmaterial Print, Lehrmaterial Digital etc.)
ab 15 €
Redaktionell
(Bücher, Bücher: Sach- und Fachliteratur, Digitale Medien (redaktionell) etc.)
ab 30 €
Werbung
(Anzeigen, Aussenwerbung, Digitale Medien, Fernsehwerbung, Karten, Werbemittel, Zeitschriften etc.)
ab 55 €
Handelsprodukte
(bedruckte Textilie, Kalender, Postkarte, Grußkarte, Verpackung etc.)
ab 75 €
Pauschalpreise
Rechtepakete für die unbeschränkte Bildnutzung in Print oder Online
ab 495 €